From fluid dynamics (CFD) to structural and thermal analysis using simulations by finite elements (FEM, FEA), we optimize your product development and help you solve all kinds of mechanical problems. We test your prototypes virtually to accelerate your market launch and provide support to secure certifications. If you wish to adapt machinery, we assist you in your decision-making process to find the most efficient design.
Simulation Services: Finite elements (FEM) and fluid dynamics (CFD)
How we work
Custom Engineering
On-Demand Engineering
Case studies
Finite Element Method (FEM) Solutions
Drop test of a Portable Storage Device (PSD)
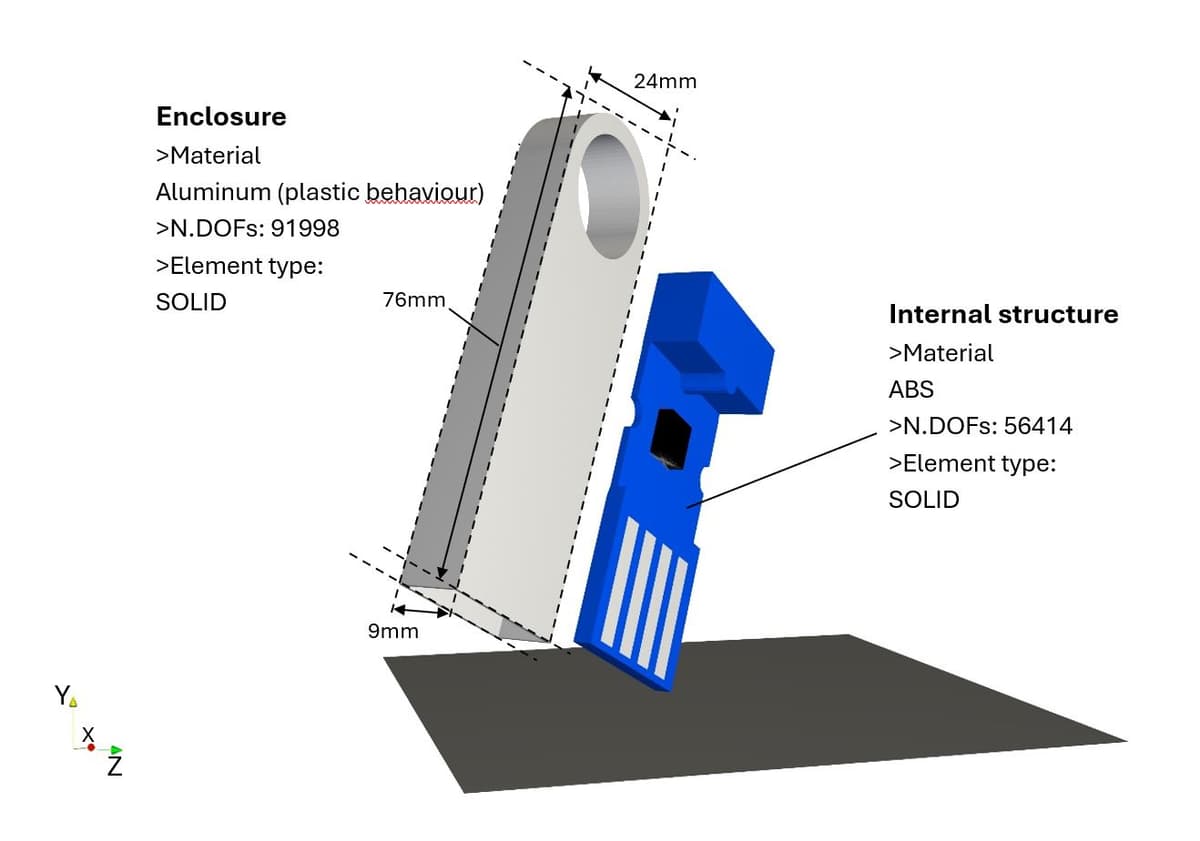
Impact position: exploded
Minimizing acceleration at sensitive components is crucial, therefore the aluminum enclosure absorbs impact energy, protecting the internal structure. Key dimensions, material properties as well as other data is included to provide context for the simulation.
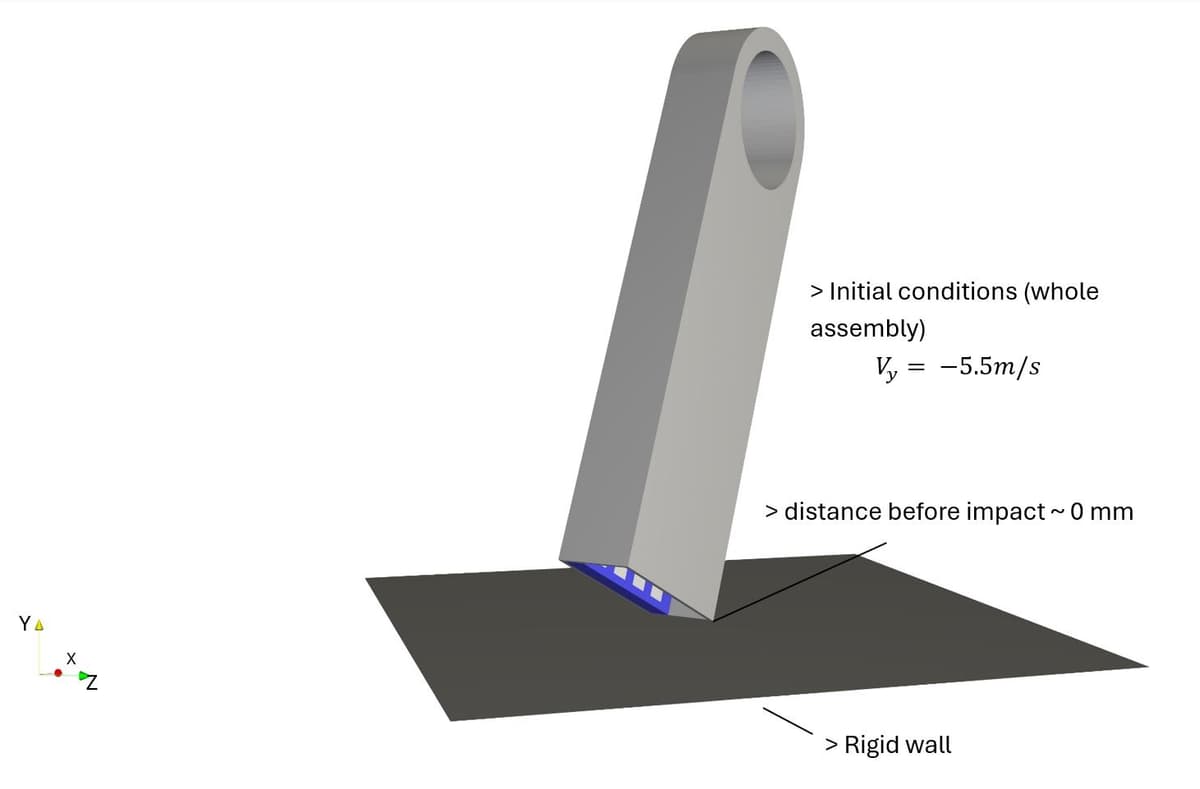
Impact position: non-exploded
The assembly is positioned close to the rigid wall to reduce simulation time, with an initial velocity of -5.5 m/s in the vertical direction. The non-deformability of the wall ensures that the structural integrity of the device can be evaluated under controlled conditions.
Plastic strain: view 1
The video illustrates the evolution of plastic strain at the impact corner, the most disadvantageous position due to resulting stress concentration. Despite this, the aluminum enclosure effectively absorbs energy, limiting plastic strain to a low max value of ~0.02.
Plastic strain: view 2
The video shows plastic strain from the opposite side. The aluminum undergoes visible plastic deformation concentrated at the impact as well as noticeable elastic deformation recovered post impact.
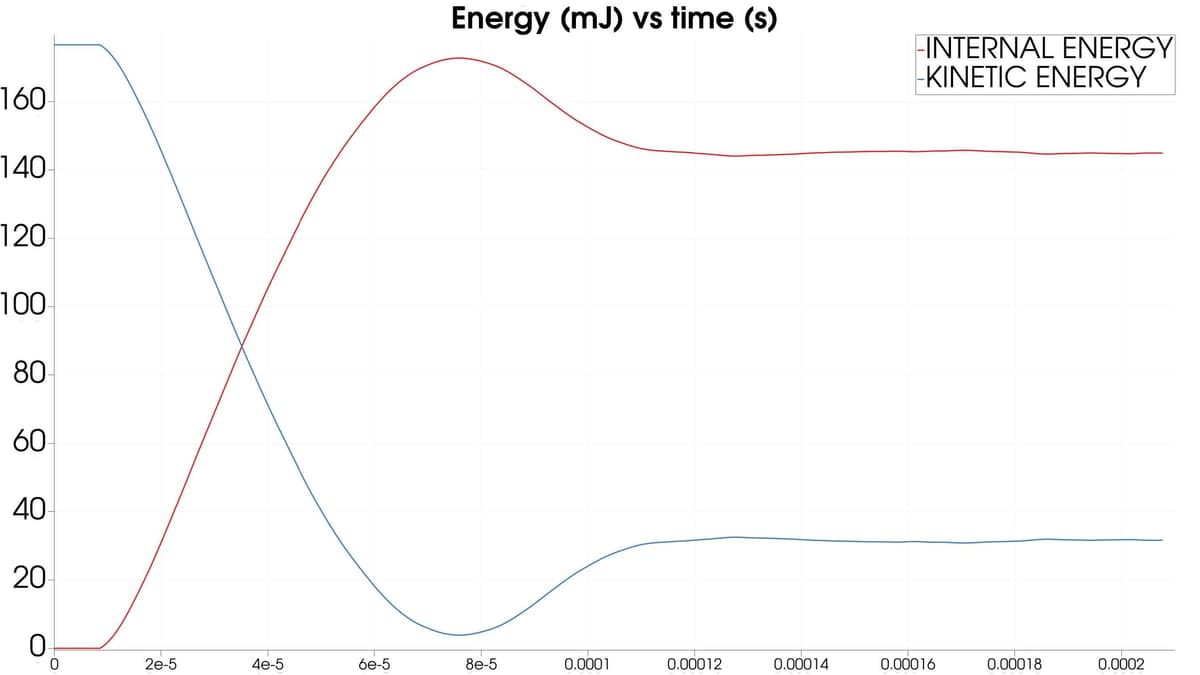
Energy balance
The graph illustrates energy transfer during impact, showing kinetic energy converting into internal energy. Kinetic energy decreases rapidly, while internal energy rises, reflecting material energy absorption and stabilization after releasing a certain amount of elastic energy.
Static simulation of a 3 point bending test
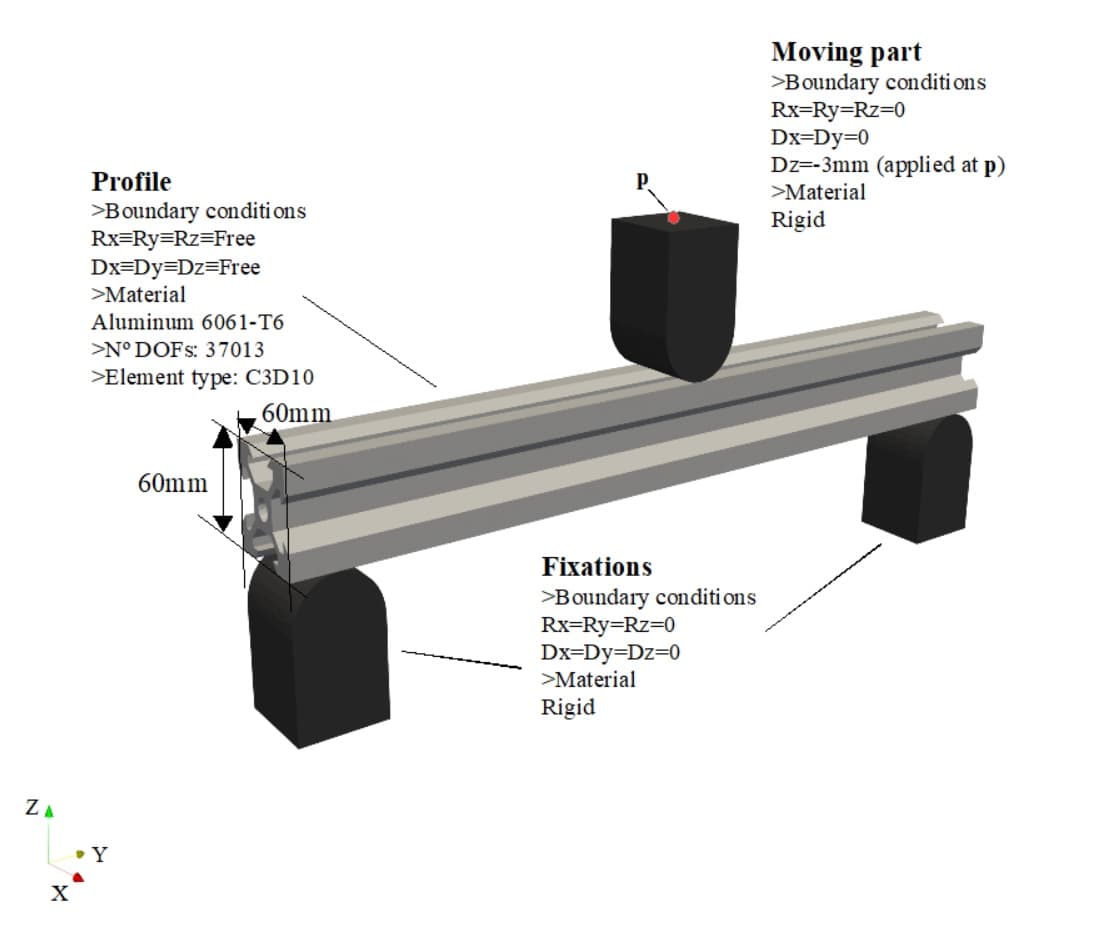
Aluminum profile: initial position
The setup shows an aluminum profile with 3mm of imposed displacement at the top by a rigid moving part and supported by rigid fixations. Its mechanical properties, boundary conditions, and key dimensions provide context for structural analysis.
Displacement vs iteration
The video shows the aluminum profile undergoing iterative displacement until reaching the imposed 3mm Z displacement boundary condition. The deformation evolves symmetrically in both sides of the profile across iterations.
Plastic strain vs iteration
The video illustrates the evolution of plastic strain as the aluminum profile reaches the imposed 3mm Z displacement. Maximum plastic strain occurs at the center of symmetry of the profile.
Reaction forces vs iteration
The video shows the reaction forces during the simulation, peaking at maximum displacement. Forces are uniformly distributed across the surface where displacement is applied and also concentrated at the fixations base, showcasing the interaction through contact surfaces.
Von Misses vs iteration
The video illustrates the von Mises stress distribution, primarily concentrated around the interaction area of the moving part. Additional stress concentration appear in regions with sharp geometric changes in the profile.
Study of the natural vibrational modes
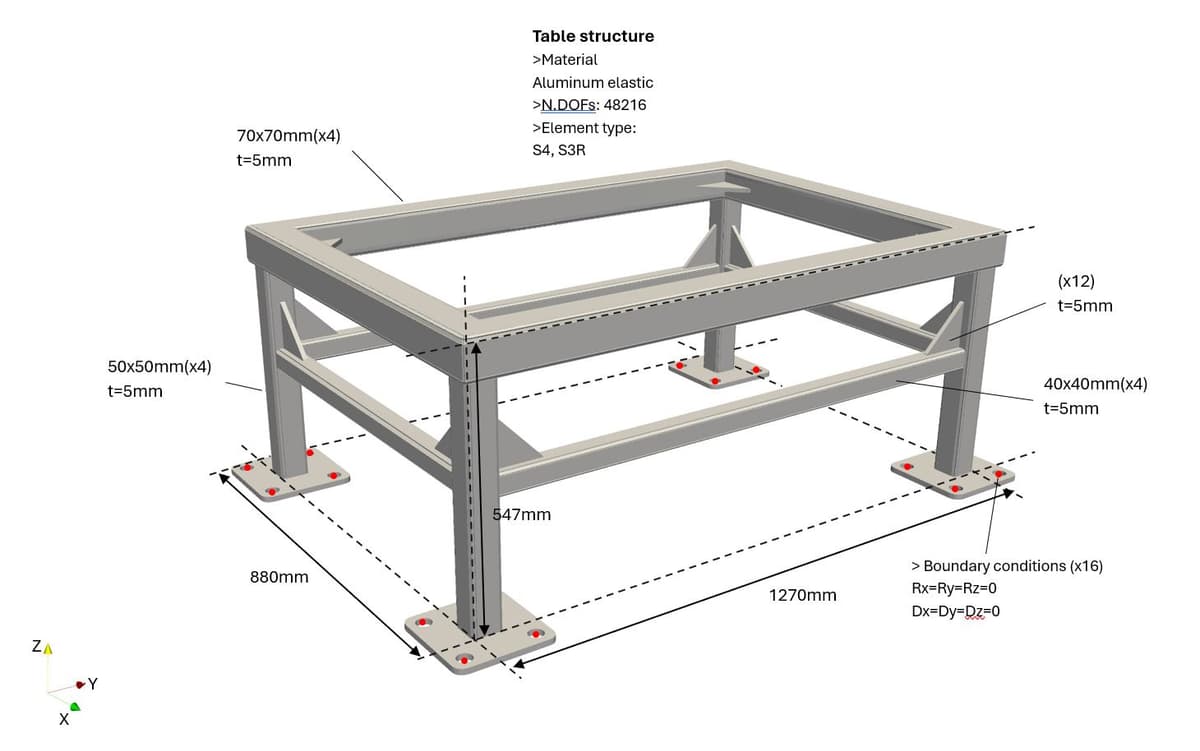
Lightweight Aluminum Frame Structure
The structure is designed to be lightweight and corrosion-resistant. It features extruded profiles with specified dimensions and thicknesses, anchored to the ground. A natural frequency study is performed to ensure its suitability under dynamic conditions
First bending mode - 81Hz
First bending mode along the table’s longer axis, with the legs acting like pivot points at the floor. As the structure oscillates in a cantilever-like fashion, the maximum displacement occurs near the middle of the tabletop. This mode illustrates how the table deforms when subjected to bending loads in its primary longitudinal direction.
Second bending mode - 84Hz
Second bending mode along the table’s shorter axis, with the legs again acting as pivot points at the floor. As the structure flexes in a similar cantilever-like fashion, the midpoint experiences the largest displacement. This mode highlights how the table displays a slightly higher frequency in this direction due to the reduced span length.
First torsional mode - 110Hz
The top ring twists about the vertical axis. There’s minimal out-of-plane bending and the ring stays nearly flat in the plane parallel to the floor. The four legs serve as pivot points, and the 'open' rectangular geometry of the frame allows each corner to shift slightly, creating that in-plane twisting motion.
Local In-plane Bending - 147Hz
This mode primarily involves the table’s smaller middle ring profiles along its longer axis moving inward and outward, while the upper, stiffer ring sees less motion. Because these profiles are thinner, they flex more easily, explaining why the top ring remains relatively still during this vibration.
In-plane shear mode - 155Hz
The top frame oscillates between two rhombic shapes. Because the ring’s in-plane stiffness is relatively low, each welded corner can slightly pivot, allowing the rectangular frame to deform like a rhombus. This motion remains mostly in the plane of the table, rather than bending out of plane.
Computer Fluid Dynamics (CFD)
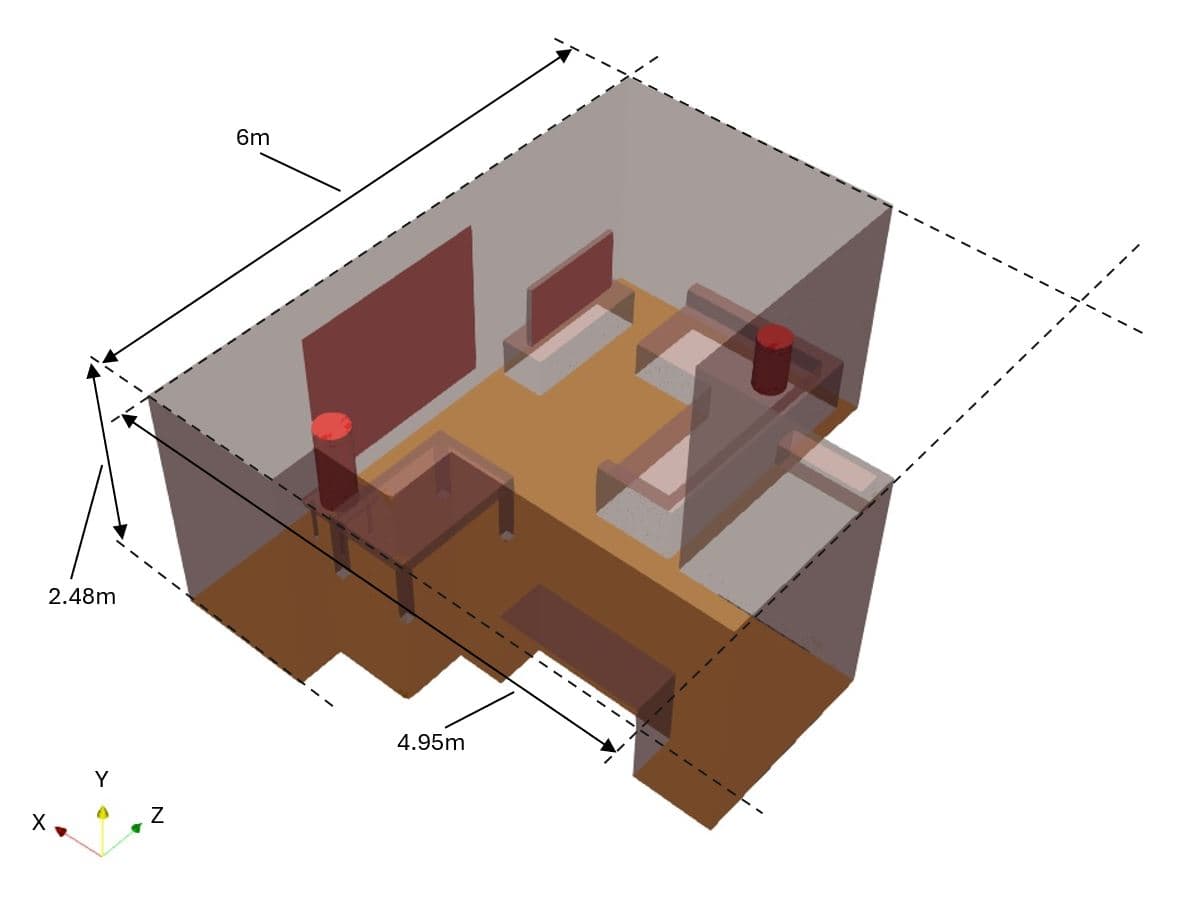
Study of a room thermal efficiency (HVAC)
Building floor room main dimensions
The image depicts the boundary conditions of the room with a window that maintains a fixed temperature, disregarding radiation and conduction as a simplification. Two people and a television interact with the environment through a fixed temperature. Colder air enters from the air conditioning unit (HVAC) at a 45° angle and uniform velocity, while the lower parts of the doors serve as pressure outlets.
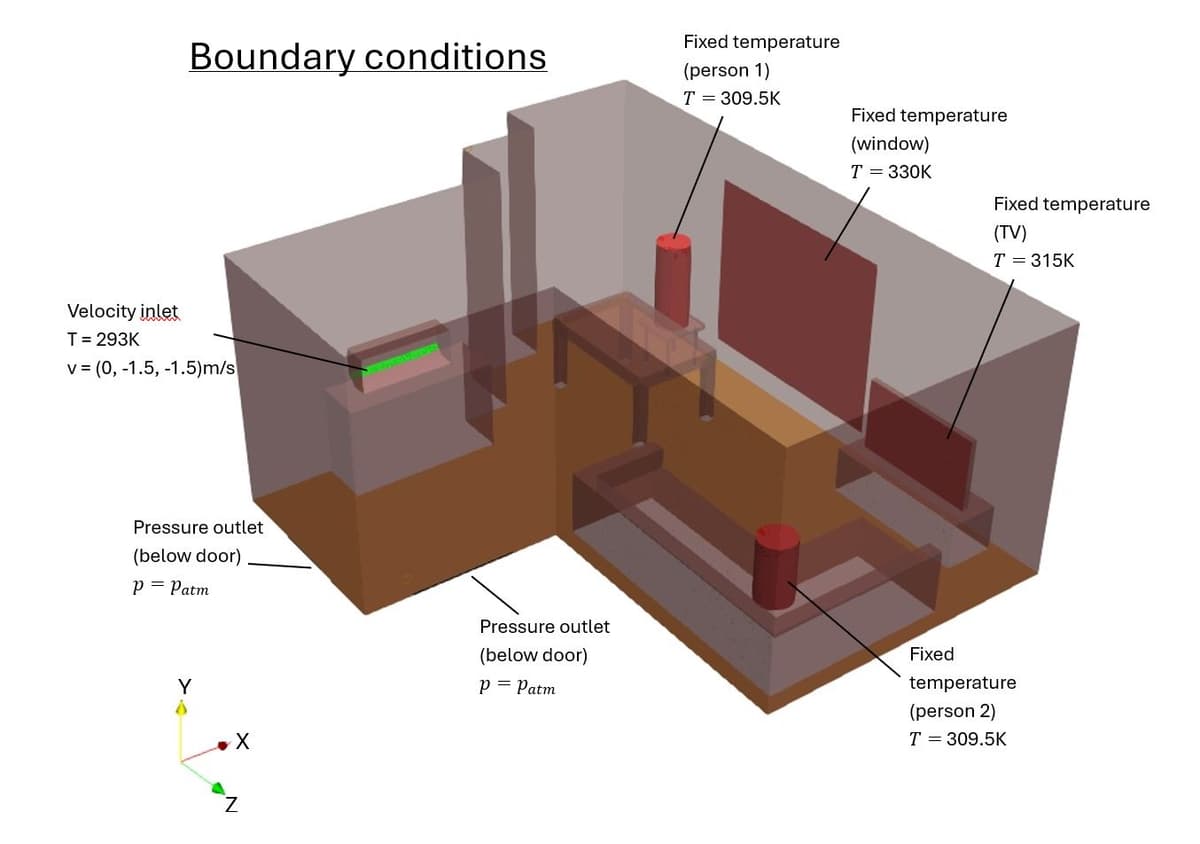
Heat sources and BCs
The image shows the room’s boundary conditions with a simplified window heat source, ignoring radiation or conduction. Two people and a TV act as fixed-temperature sources. Cooler air enters from the AC at a 45° angle, while the door bottoms serve as pressure outlets.
Velocity and temperature - view 1
This video tracks velocity magnitudes and temperatures over a 50s transient simulation. Tracer lines from the AC show cooling air mostly affecting a less critical zone, leaving occupants’ area relatively warm. Although only some paths are displayed, friction implies a similar pattern near the pathlines. These findings confirm the HVAC unit suboptimal placement.
Velocity and temperature - view 2
This video highlights how the cooling air remains mostly within a confined zone, suggesting potential recirculation and inefficient heat dissipation. Although the recirculation is not directly visible here, the surrounding walls create a space prone to airflow loops, situation that will be examined in the next video.
Recirculation pattern
This video presents a plane section through the HVAC unit, displaying in-plane velocity vectors. Notably, the flow descending from the top of the unit forms a recirculation loop constrained by surrounding walls, limiting direct airflow to occupant areas and suggesting inefficiencies in the system's placement.
Temperature isovolume
This video displays an isovolume zone marking temperatures within a specified range, highlighting the 3D distribution of cooler air. The room, initially at 300K, experiences about a max. of 1.5K drop in these regions, while other areas remain above the threshold. This limited cooling area indicates suboptimal air distribution, and potentially the need for higher AC power resulting in an increase in energy costs with the current AC position.
Blog
Work with us B2B
We invite skilled simulation engineers to collaborate on innovative projects.
- Work on diverse and exciting projects
- Professional growth and development
- Flexible collaboration arrangements
About Prosimcae
- Background in both the automotive and industrial sectors.
- In-depth experience in FEA (Finite Element Analysis) and CFD (Computational Fluid Mechanics).
- Authored a peer-reviewed CFD publication and successfully oversaw projects that reduced prototyping costs and accelerated design timelines.
- Operating as a remote-first consultancy working with clients nationally and internationally for fast, flexible, and cost-effective simulation services.